pyhtmlchart
pyhtmlchart is a Python library to make Google Charts in Python! This library uses
Google Charts to visualize data.
This library is easy to use. Using pyhtmlchart you can create many charts such as:
- Line Chart
- Column Chart
- Bar Chart
- Area Chart
- Pie Chart
- Graphical Table
- Multiple Charts
Introduction
pythmlchart is a Python library to make Google Charts in Python! This library uses
Google Charts to visualize data.
This library is easy to use. When you make a chart, it is stored as a
.html file and it opens automatically. The chart also has a auto update feature which automatically updates a chart!
Installation
To install pyhtmlchart type pip install pyhtmlchart in the command prompt.
Import
Type import pyhtmlchart to import the module.
After installing try the code below.
Following are some programs to make some simple charts:
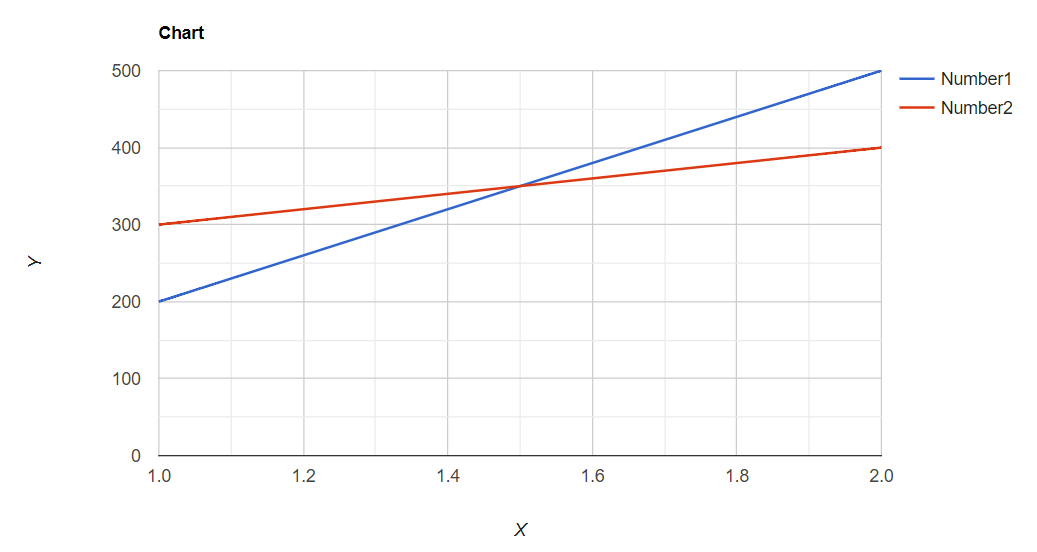
Line Chart
Code to make a simple Line Chart:
import pyhtmlchart as chart
line_chart = chart.line_chart.LineChart(location='line', title='Chart')
columns = ['Time', 'Number1', 'Number2']
all_data = [[1, 200, 300], [2, 500, 400]]
line_chart.add_data(data=all_data, data_titles=columns)
line_chart.open()
The above code will open the following chart in the browser:
 Learn more about Line Chart
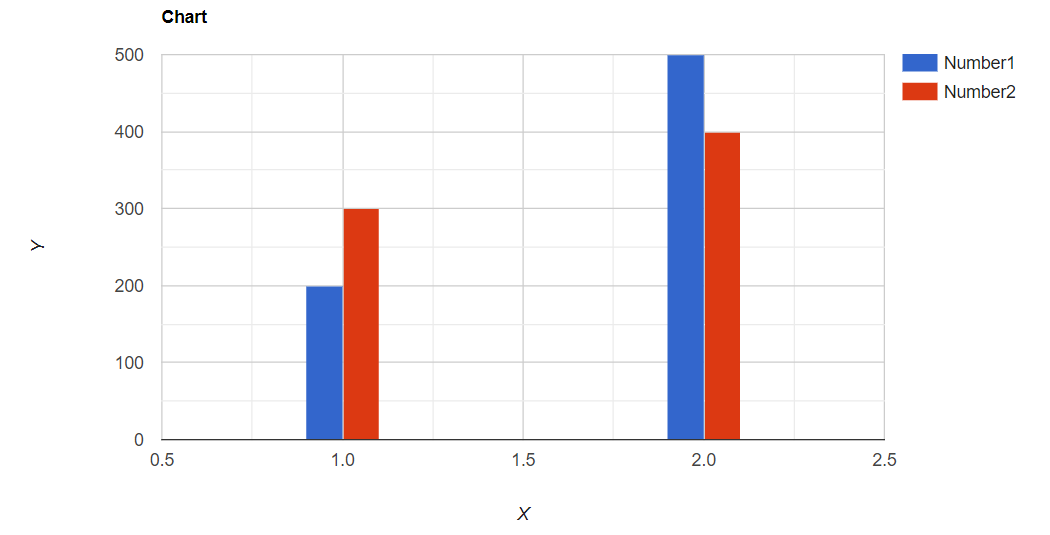
Column Chart
Code to make a simple Column Chart:
import pyhtmlchart as chart
column_chart = chart.column_chart.ColumnChart(location='column', title='Chart')
columns = ['Time', 'Number1', 'Number2']
all_data = [[1, 200, 300], [2, 500, 400]]
column_chart.add_data(data=all_data, data_titles=columns)
column_chart.open()
The above code will open the following chart in the browser:
 Learn more about Column Chart
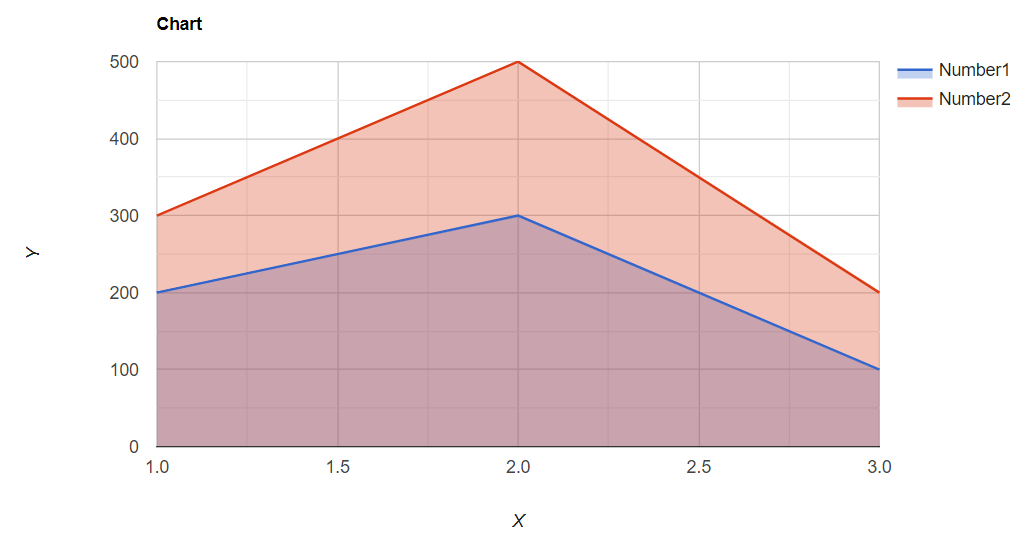
Area Chart
Code to make a simple Area Chart:
import pyhtmlchart as chart
area_chart = chart.area_chart.AreaChart(location='area', title='Chart')
columns = ['Time', 'Number1', 'Number2']
all_data = [[1, 200, 300], [2, 300, 500], [3, 100, 200]]
area_chart.add_data(data=all_data, data_titles=columns)
area_chart.open()
The above code will open the following chart in the browser:
 Learn more about Area Chart
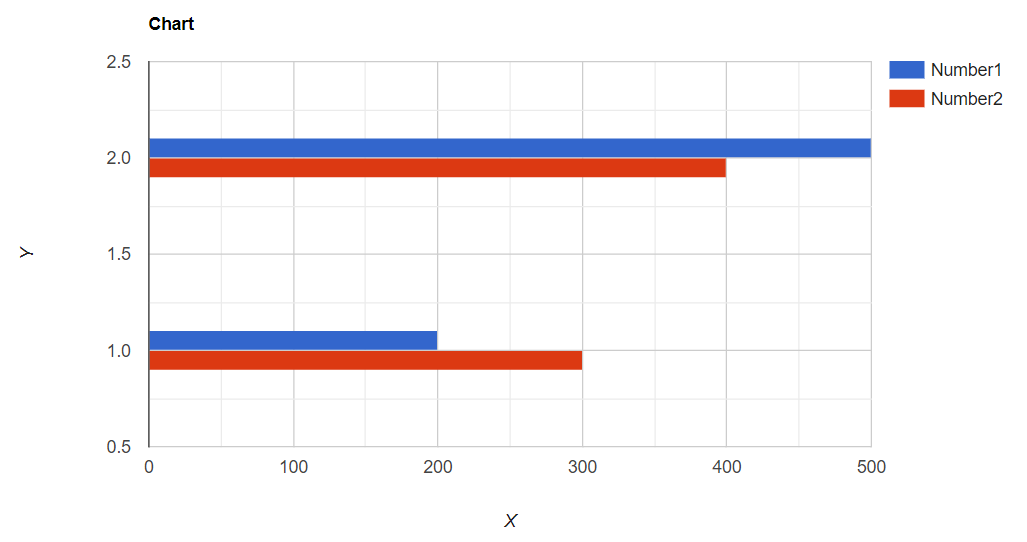
Bar Chart
Code to make a simple Bar Chart:
import pyhtmlchart as chart
bar_chart = chart.bar_chart.BarChart(location='bar', title='Chart')
columns = ['Time', 'Number1', 'Number2']
all_data = [[1, 200, 300], [2, 500, 400]]
bar_chart.add_data(data=all_data, data_titles=columns)
bar_chart.open()
The above code will open the following chart in the browser:
 Learn more about Bar Chart
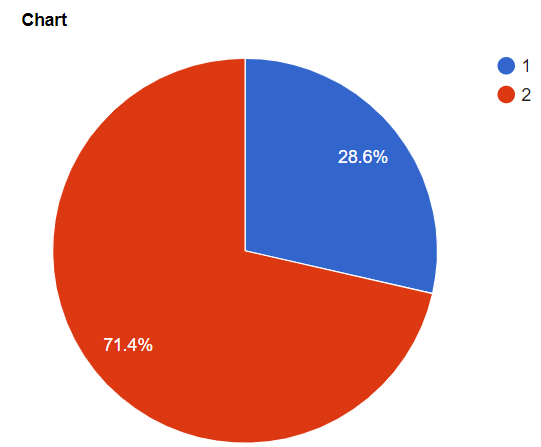
Pie Chart
Code to make a simple Pie Chart:
import pyhtmlchart as chart
pie_chart = chart.pie_chart.PieChart(location='pie', title='Chart')
columns = ['Time', 'Number1']
all_data = [['1', 200], ['2', 500]]
pie_chart.add_data(data=all_data, data_titles=columns)
pie_chart.open()
The above code will open the following chart in the browser:
 Learn more about Pie Chart
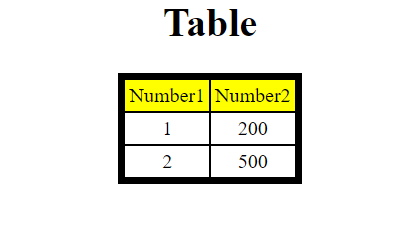
Simple Table:
Code to make a simple Table:
import pyhtmlchart as chart
table = chart.table.Table(location='table', title='Table')
columns = ['Number1', 'Number2']
all_data = [[1, 200], [2, 500]]
table.add_data(data=all_data, columns=columns)
table.open()
The above code will open the following table in the browser:
 Learn more about Table


