Tutorial:
Line Chart
Code to make a simple Line Chart:
import pyhtmlchart as chart
line_chart = chart.line_chart.LineChart(location='line', title='Chart')
columns = ['Time', 'Number1', 'Number2']
all_data = [[1, 200, 300], [2, 500, 400]]
line_chart.add_data(data=all_data, data_titles=columns)
line_chart.open()
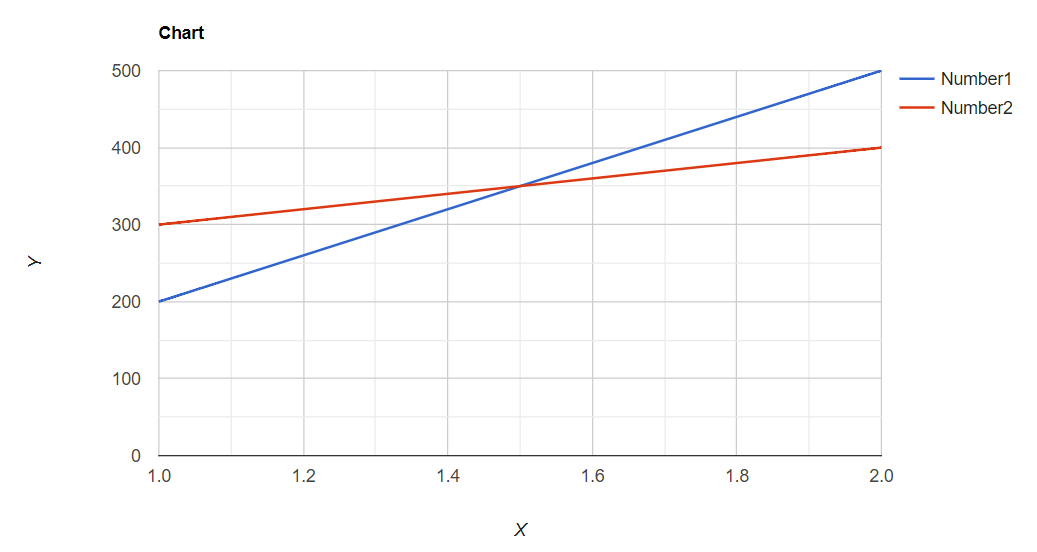
The above code will open the following chart in the browser:
 Learn more about Line Chart
Column Chart
Code to make a simple Column Chart:
import pyhtmlchart as chart
column_chart = chart.column_chart.ColumnChart(location='column', title='Chart')
columns = ['Time', 'Number1', 'Number2']
all_data = [[1, 200, 300], [2, 500, 400]]
column_chart.add_data(data=all_data, data_titles=columns)
column_chart.open()
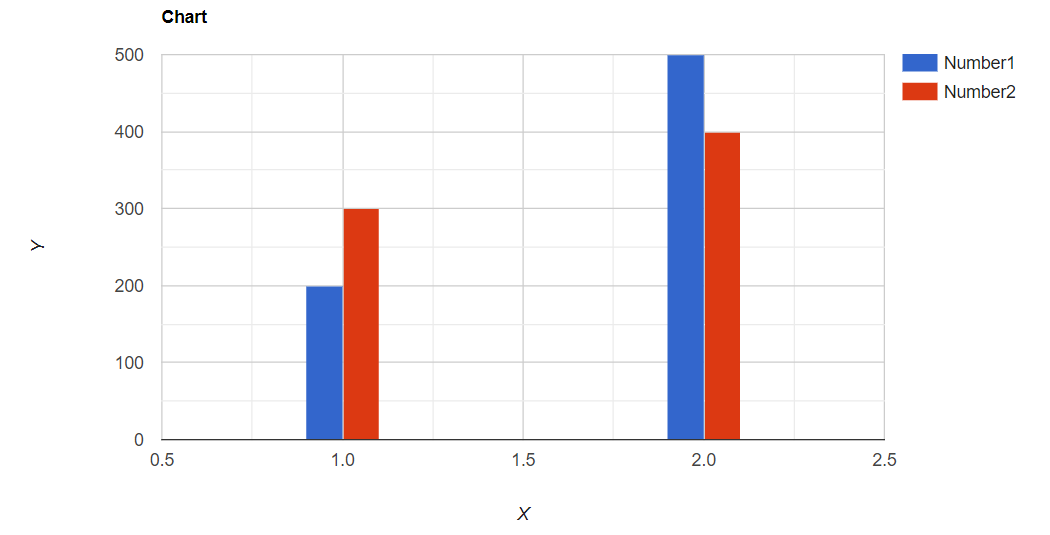
The above code will open the following chart in the browser:
 Learn more about Column Chart
Area Chart
Code to make a simple Area Chart:
import pyhtmlchart as chart
area_chart = chart.area_chart.AreaChart(location='area', title='Chart')
columns = ['Time', 'Number1', 'Number2']
all_data = [[1, 200, 300], [2, 300, 500], [3, 100, 200]]
area_chart.add_data(data=all_data, data_titles=columns)
area_chart.open()
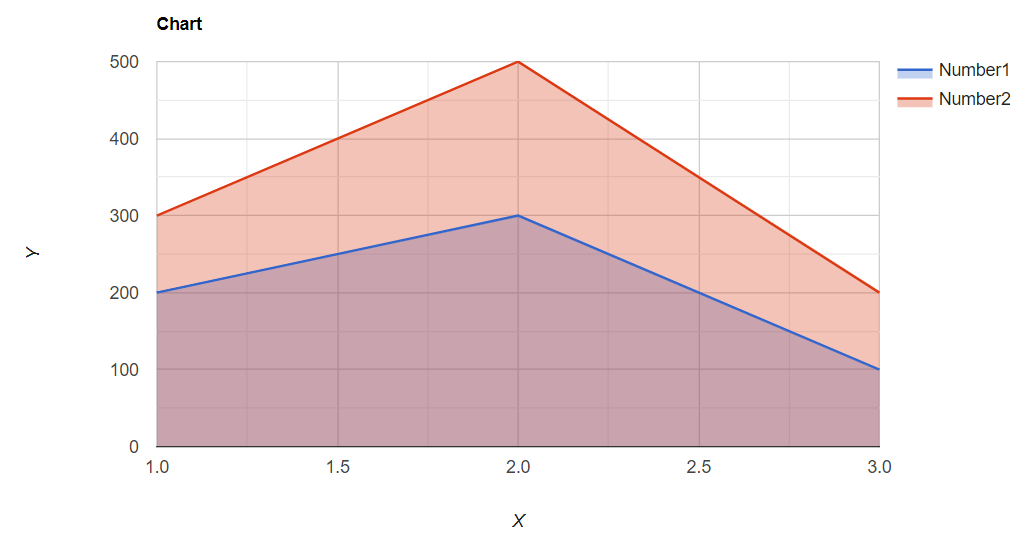
The above code will open the following chart in the browser:
 Learn more about Area Chart
Bar Chart
Code to make a simple Bar Chart:
import pyhtmlchart as chart
bar_chart = chart.bar_chart.BarChart(location='bar', title='Chart')
columns = ['Time', 'Number1', 'Number2']
all_data = [[1, 200, 300], [2, 500, 400]]
bar_chart.add_data(data=all_data, data_titles=columns)
bar_chart.open()
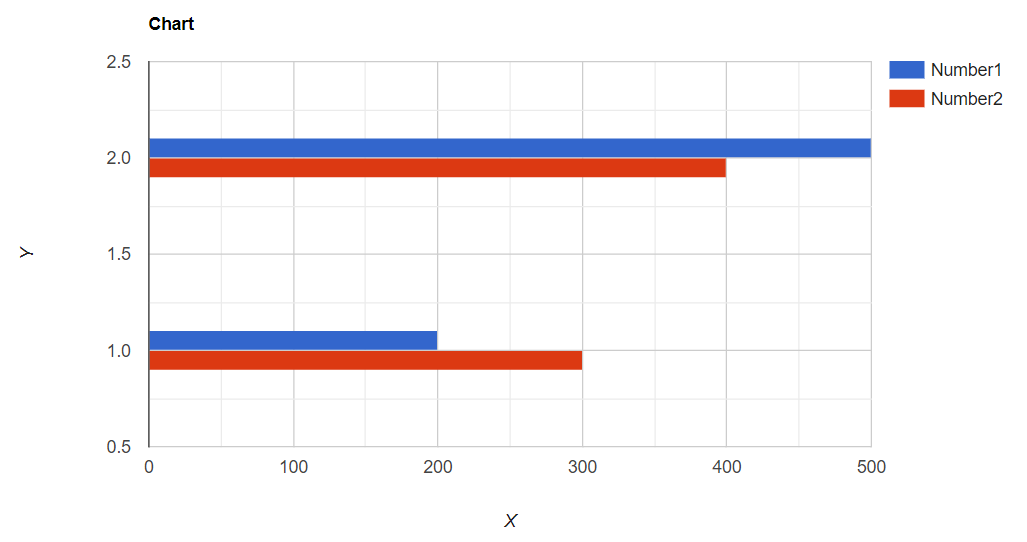
The above code will open the following chart in the browser:
 Learn more about Bar Chart
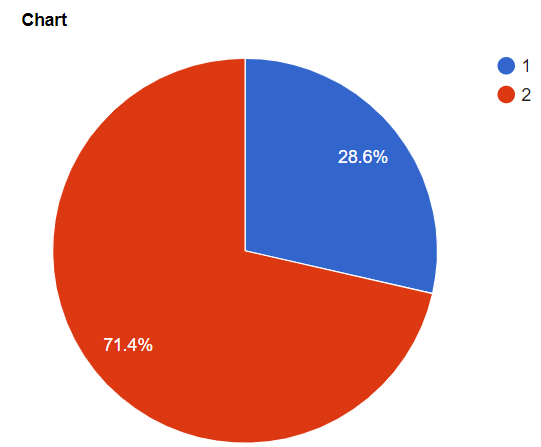
Pie Chart
Code to make a simple Pie Chart:
import pyhtmlchart as chart
pie_chart = chart.pie_chart.PieChart(location='pie', title='Chart')
columns = ['Time', 'Number1']
all_data = [['1', 200], ['2', 500]]
pie_chart.add_data(data=all_data, data_titles=columns)
pie_chart.open()
The above code will open the following chart in the browser:
 Learn more about Pie Chart
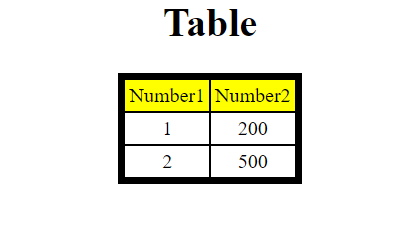
Simple Table:
Code to make a simple Table:
import pyhtmlchart as chart
table = chart.table.Table(location='table', title='Table')
columns = ['Number1', 'Number2']
all_data = [[1, 200], [2, 500]]
table.add_data(data=all_data, columns=columns)
table.open()
The above code will open the following table in the browser:
 Learn more about Table


